SOUND
Sound is an analogous phenomenon – a physical phenomenon that could be represented as continuously changing voltages.
Computers that we use require a discrete representation of sound. In particular, when sound is captured as data in a computer, it is represented as a list of numbers. Capturing sound in a form that can be handled by a computer is a process called analog-to-digital conversion(ADC), whereby the amplitude of a sound wave is measured at evenly-spaced intervals in time – typically 44,100 times per second, or even more which is actually called the sampling rate..Once a computer has captured sound as a list of numbers, a whole host of mathematical operations can be performed on the sound to change its loudness, pitch, frequency balance, and so forth. In a digital audio editing program like Audition, a sound wave is stored as a list of numbers, corresponding to the amplitude of the sound at each point in time.
-
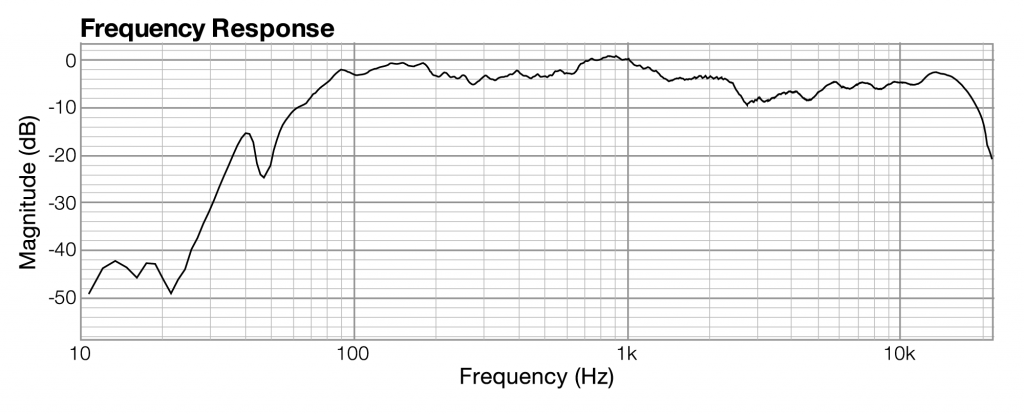
With regard to an audio filter, the frequency response shows how a filter boosts or attenuates the frequencies in the sound to which it is applied.
-
The graph in the frequency analysis view is called a frequency response graph or simply a frequency response.
| graph type | domain (x-axis) | range (y-axis) |
|---|---|---|
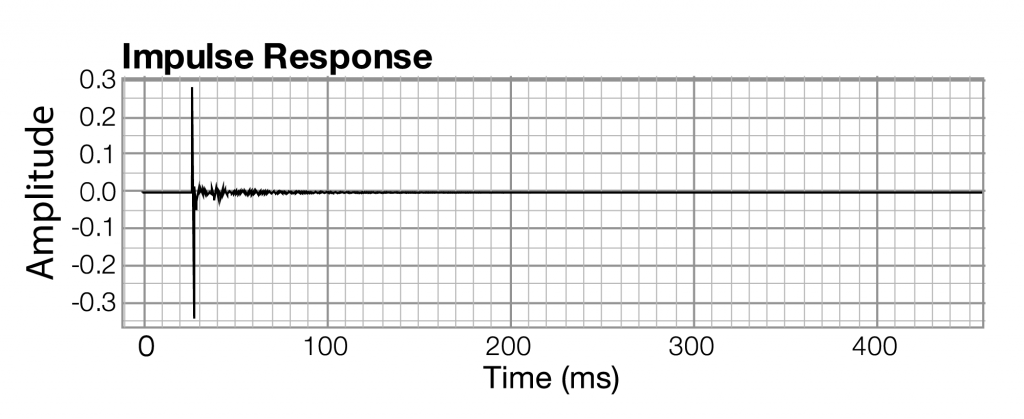
| impulse response | time | amplitude of sound at each moment in time |
| frequency response | frequency | magnitude of frequency across the audible spectrum of sound |
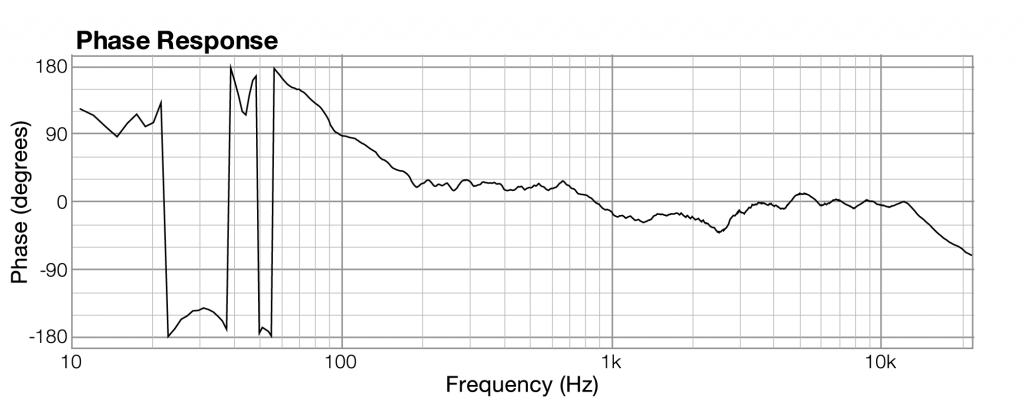
| phase response | frequency | phase of frequency across the audible spectrum of sound |
All you need to understand is that when sound is captured and put into a form that can be handled by a computer, it is nothing more than a list of numbers, each number representing the amplitude of sound at a moment in time.
Related to each impulse response graph are two other graphs – a frequency response graph that shows “how much” of each frequency is present in the instance of sound, and a phase response graph that shows the phase that each frequency component is in. Each of these two graphs covers the audible spectrum. In Section 3, you’ll be introduced to the mathematical process – the Fourier transform – that converts sound data from the time domain to the frequency and phase domain. Applying a Fourier transform to impulse response data – i.e., amplitude represented in the time domain – yields both frequency and phase information from which you can generate a frequency response graph and a phase response graph. The frequency response graph has the magnitude of the frequency on the y-axis on whatever scale is chosen for the graph. The phase response graph has phases ranging from -180° to 180° on the y-axis.
The main points to understand are these:
- A graph is a visualization of data.
- For any given instance of sound, you can analyze the data in terms of time, frequency, or phase, and you can graph the corresponding data.
- These different ways of representing sound – as amplitude of sound over time or as frequency and phase over the audible spectrum – contain essentially the same information.
- The Fourier transform can be used to transform the sound data from one domain of representation to another. The Fourier transform is the basis for processes applied at the user-level in sound measuring and editing software.
- When you work with sound, you look at it and edit it in whatever domain of representation is most appropriate for your purposes at the time. You’ll see this later in examples concerning frequency analysis of live performance spaces, room modes, precedence effect, and so forth.
FAST FOURIER TRANSFORM
The "literal" implementation of the transform is computationally expensive. The equation in Algorithm 2.1 has to be applied N times, where N is the number of audio samples. The equation itself has a summation that goes over N elements. Thus, the discrete Fourier transform takes on the order of N*N operations.
The fast Fourier transform (FFT) is a more efficient implementation of the Fourier transform that does on the order of N∗log2NN∗log2N operations. The algorithm is made more efficient by eliminating duplicate mathematical operations. The FFT is the version of the Fourier transform that you'll often see in audio software and applications. For example, Adobe Audition uses the FFT to generate its frequency analysis view.